113 Interesting Car Buying Statistics & Trends [Updated for 2024]

We’ve put together a list of the most important and interesting stats about buying cars in 2024.
You’ll discover the latest car trends, including popular electric vehicles and features that buyers want most. This guide is full of essential numbers and facts to keep you informed about car buying.
These stats are great for car enthusiasts and potential buyers alike, offering insights into the current car market.
Need an expert quote for your story? We’re happy to help. Contact our Senior Editor, Steve Birkett.
Key Car Buying Statistics

- The full-year 2024 forecast is 15.7 million as of Jan. 8, 2024, following the final analysis of FY2023 sales.
- U.S. car sales reached an estimated 15.5 million units in 2023, an 11.6% jump from 13.9 million vehicles sold in 2022.
- Used car prices are expected to stabilize in 2024 after two years of decreases from record highs during the pandemic.
- New car prices are down 1.4% since October 2022 and 3.5% since their peak in December 2022.
- The average price for a new car in October was $44,331, an increase of less than 1% from one year prior.
- The top-selling trucks and SUVs for 2023 were the Ford F-Series (750,789 units sold), the Chevy Silverado (543,319 units sold), and the Ram Pickup (444,926 units sold).
- The top-selling cars were the Tesla Model Y (385,900 units sold, estimated), the Toyota Camry (290,649 units sold), the Tesla Model 3 (232,700 units sold, estimated), and the Toyota Corolla (232,370 units sold).
- Cox Automotive estimates the used-vehicle market, from all retail and private transactions, probably beat its forecast and finished 2023 near 35.9 million, a bit below last year’s 36.3 million.
- Total used-vehicle sales in December finished near 2.6 million units, up 2.1%, around 54,000 units, from December 2022.
- The average price of a used EV is down to $37,000 in 2024.
Car Manufacturer Market Share Statistics

No surprises here, GM, Ford, and Toyota are still the top players in the industry.
- GM finished 2023 as market leader in the U.S. with a 16.6% market share and a total sale of 2,582,491 vehicles.
- Toyota came in second with 2,225,767 cars and trucks sold.
- Ford came in at a distant third with 1,961,935 vehicles sold.
Car Purchases by Ethnicity

Market share by ethnicity varies widely based on the region you’re living in, but here are the most recent stats regarding the breakdown of car buying by ethnicity.
- Hispanic share of the new vehicle market climbed almost three percentage points since 2016 to 17% of the market this past September.
- Asian share climbed almost two percentage points to 8%.
- Black market share declined slightly to 8% in the same timeframe.
- The market shares for each of these three ethnic groups vary by region; the Black share is the highest in the Southeast US at 15%.
- Asians account for 16% of registrations in the Western US.
- Hispanic share of 30% in the Southwest leads all other regions.
- 14% of people of color reported not having access to a car.
- 18% of Black households did not have access to a car.
- 13% of Native American households did not have access to a car.
- Asian/Pacific Islander and Latino households did not have access to a car.
- 6% of white households reported not having access to a car.
Car Buyer Demographics & Preferences
With a large portion of the population holding a driver’s license and even more having access to a vehicle, there are a lot of folks buying cars these days.
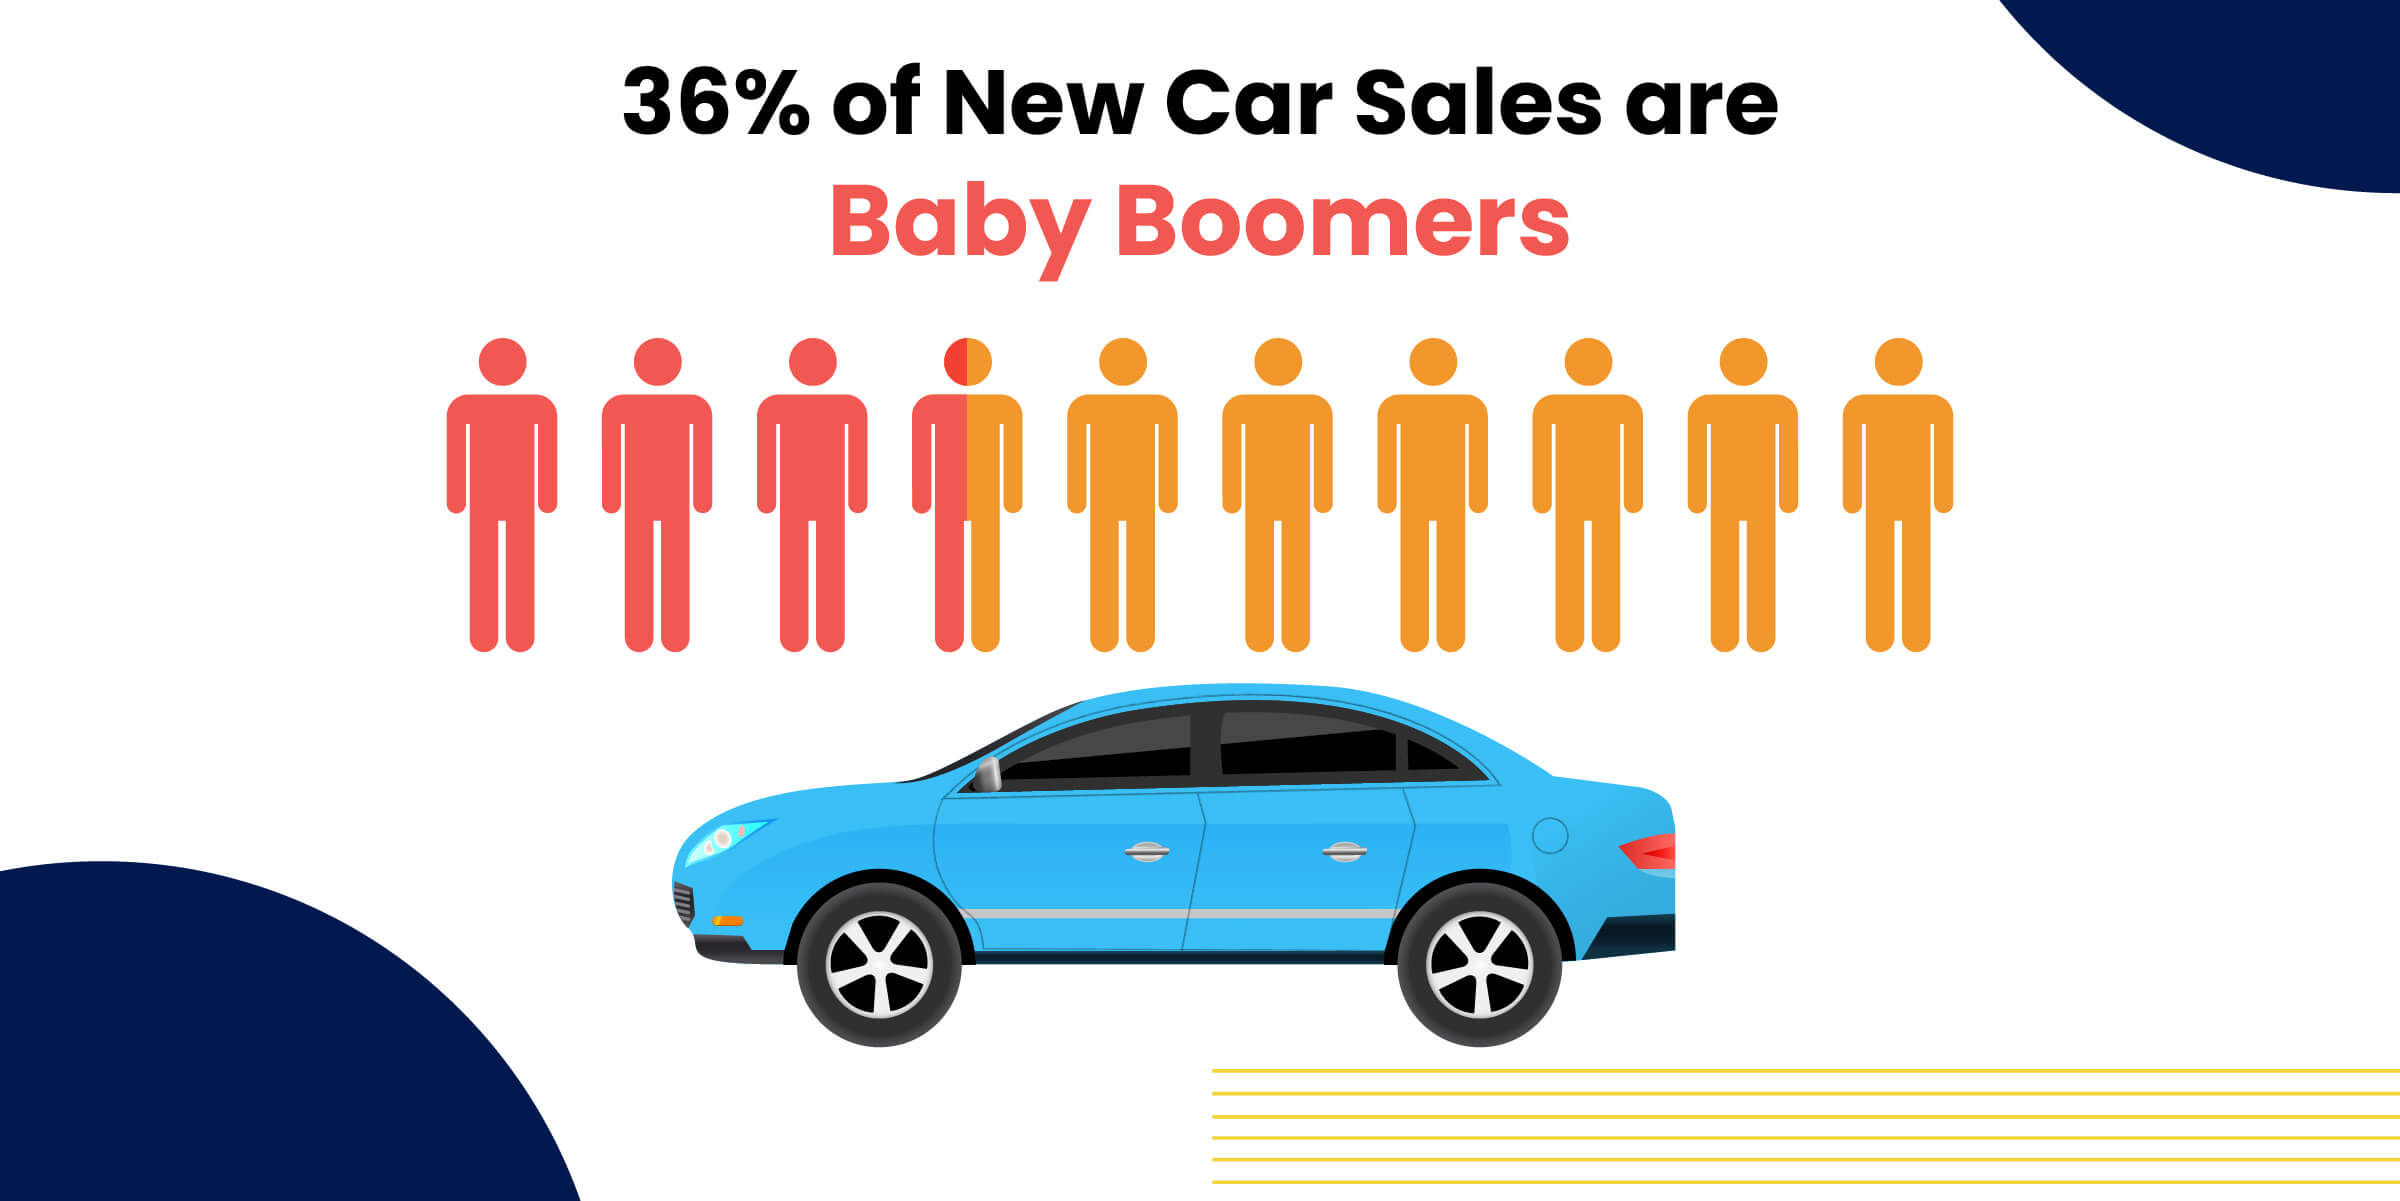
Some highlights that you may have guessed already: Boomers buy over half of the new cars in the US, a vast majority of car buyers are homeowners vs. only 7% of buyers renting their home, and the type of car purchased correlates with the buyer’s household income.
- 91.7% of households had at least one vehicle. Only 8.3% of households did not have a vehicle.
- Baby Boomers were the largest generation of new car buyers in the United States, representing around 36% of new car sales.
- 89% of Americans have a driver’s license.
- The age of a new car or truck buyer in 2022 was an average age of 50 years old (new buyers at 51 and used buyers at 49.)
- 67% of new-vehicle buyers had incomes over $75,000
- 55% of used-vehicle buyers were in the over $75,000 bracket

- The household income averages for new SUV purchases are 31% under $50k, 19% $50-$74k, 10% $75-$99k, and 40% $100k and up.
- Household income averages for new sedan buyers are 39% under $50k, 18% $50-$74k, 9% $75-$99k, and 35% $100k and up.
- Household income averages for new truck purchases are 37% under $50k, 20% $50k-$74k, 10% $75-$99k, and 33% $100k and up.
- Household income averages for new plug-in hybrid cars are 21% under $50k, 12% $50k-$75k, 10% $75k-$99k, and 57% $100k and up.
- Household income averages for new battery electric vehicles are 20% under $50k, 16% $50k-$74k, 4% $75k-$99k, and 60% $100k and up.
- 43% of car owners are female and 57% are male.
- Sedans are purchased by 44% female buyers and 56% male.
- New trucks are purchased by 14% females and 86% males.
- 93% of new car buyers are homeowners compared to only 7% of new car buyers being renters.
- 64% of new car buyers rated affordability as “important.”
- When buying a new car, 53% of car buyers consider the total purchase price.
- 20% instead consider the monthly payment.

- The remaining 27% considers both the total purchase price and the monthly payment.
- Buyers that are aged 25 to 54 purchase most new vehicles.
- When it comes to purchasing a new sedan, 1% of buyers are 24 and younger, 51% are aged 25-54, 21% are aged 55-64, and 27% are aged 65 and up.
- The age breakdown for new truck buyers according to age group is 1% age 24 and younger, 50% age 25-54, 23% age 55-64, and 26% age 65 and up.
Online Car Buying Consumer Habits
We buy just about everything else online, so why would a car purchase be any different?
Online car buying saves time, money, and reduces the stress of the back-and-forth you have to deal with when purchasing in person (a huge win for introverts.)
While the online car buying market has grown significantly with no signs of slowing down, some car buyers still need to see a car in person to feel confident making a purchase.
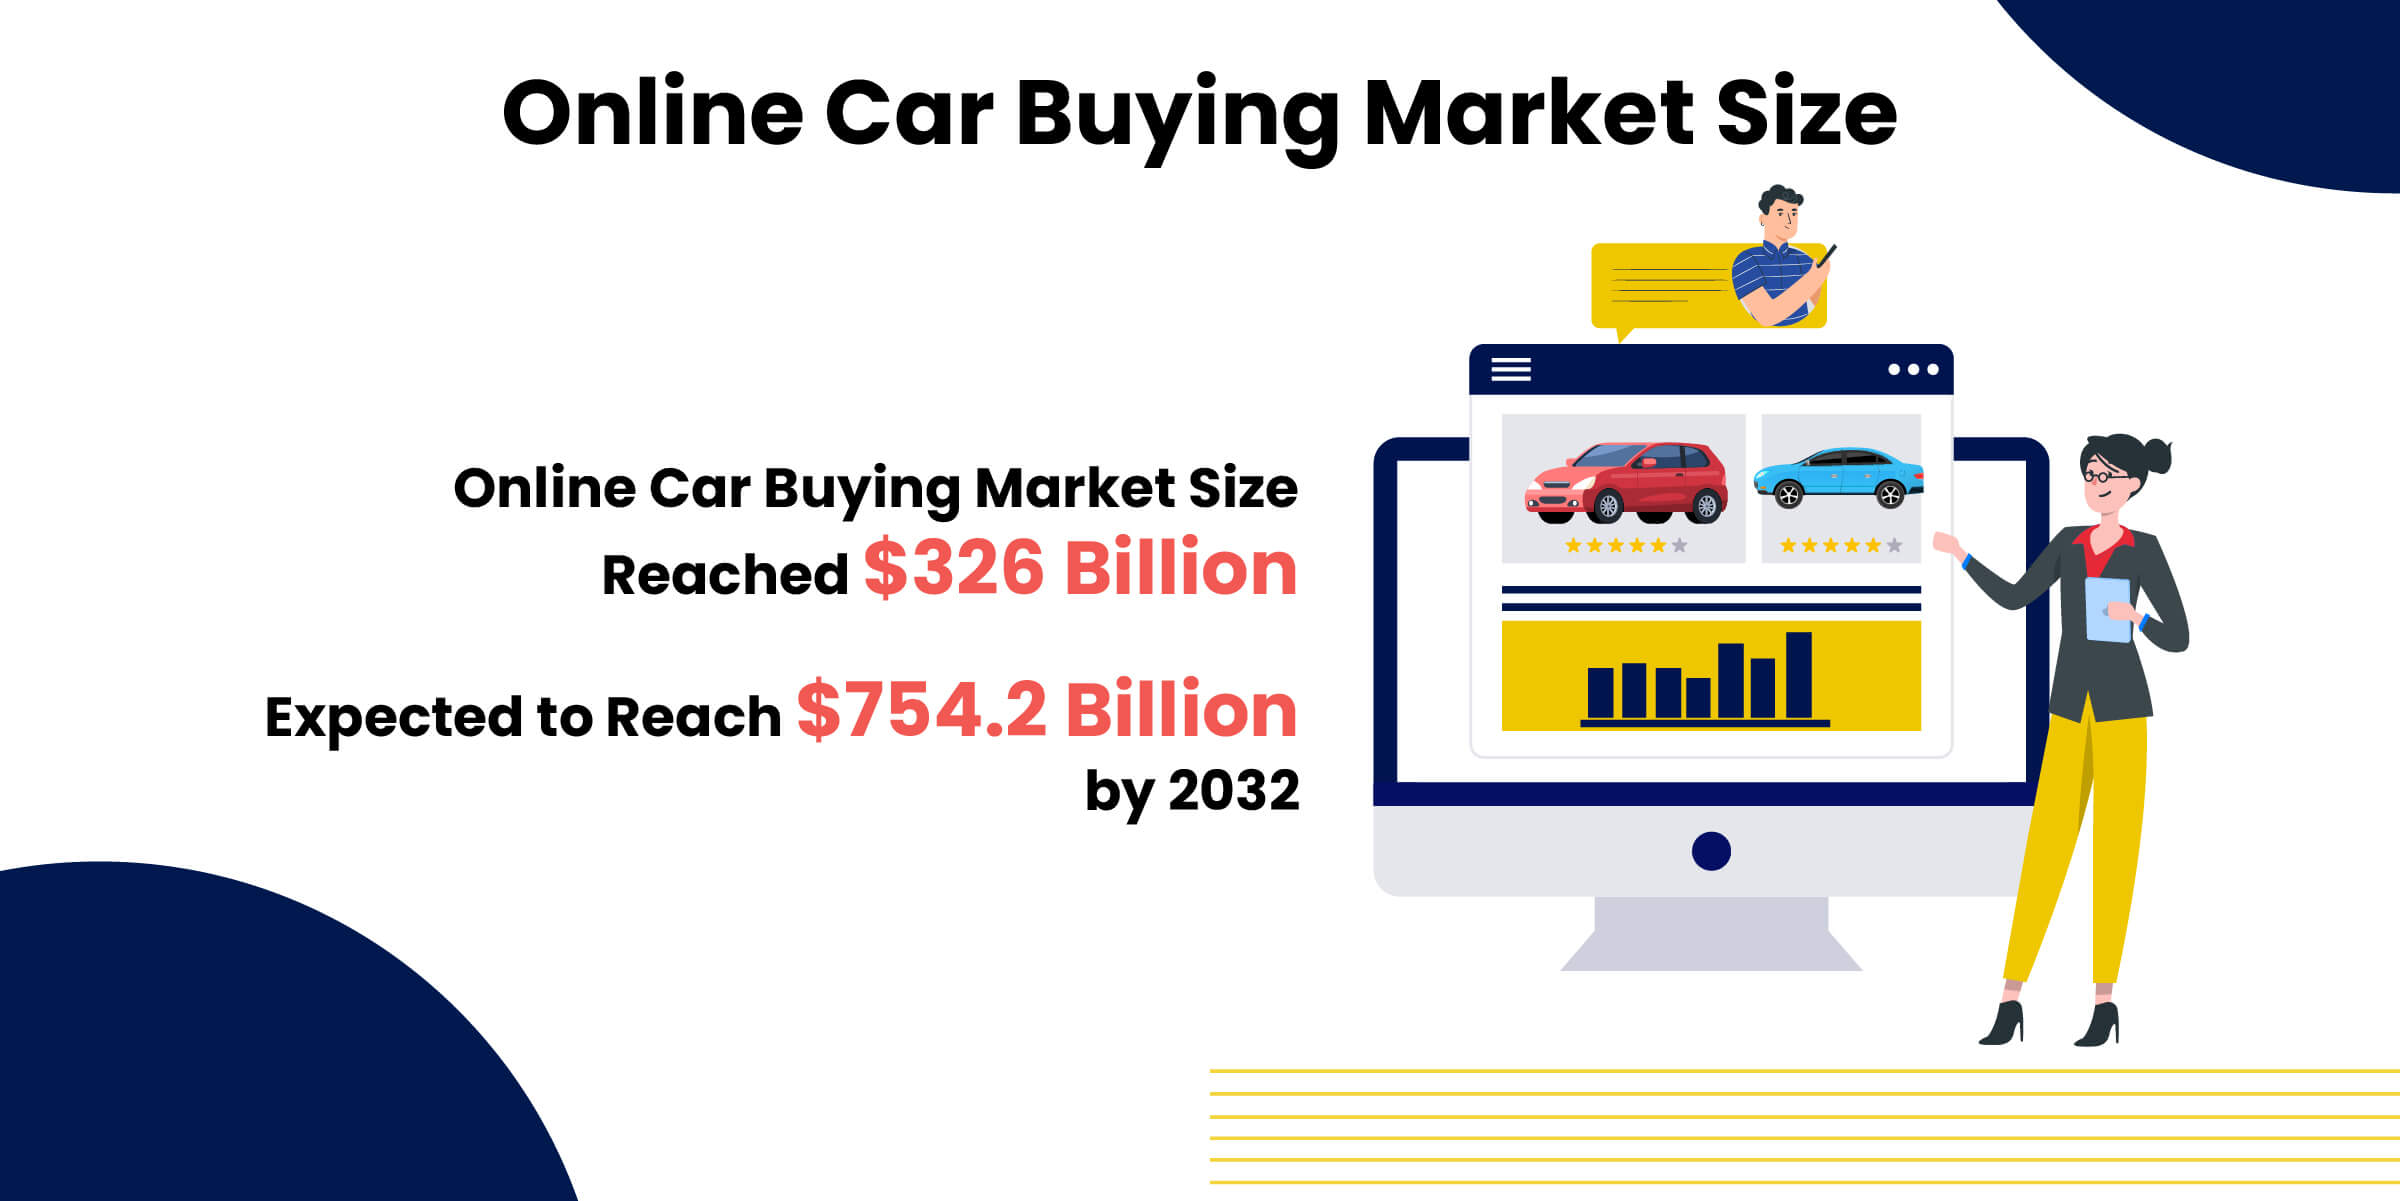
- The global online car buying market size reached US$ 326.0 Billion in 2023.
- IMARC Group expects the market to reach US$ 754.2 Billion by 2032, showing a growth rate (CAGR) of 9.6% during 2024-2032.
- The most popular style to purchase online is a hatchback, followed by sedans then SUVs.
- Almost 70% of shoppers expected to find the ability to pay for their car on a dealership website, and 83% indicated that online buying technology would help them narrow down their vehicle choice.
- 41% of Cars.com’s in-market audience is also looking to sell their current vehicle before buying a new one.
- The market size of the Online Car Dealers industry in the US was $44.3 billion in 2023.
- The market size of the Online Car Dealers industry in the US increased 6.8% in 2023.
- The market size of the Online Car Dealers industry in the US has grown 3.5% per year on average between 2018 and 2023.
- Some of the major players in the global online car-buying market include Cargurus Inc., CarsDirect.com, Cars.com Inc., and TrueCar Inc.
- New car buyers spend an average of 19 hours researching what vehicle they want on Cars.com.
- 45% of car buyers who use digital tools for financing say the car buying experience has gotten easier in the past year.
- 96% of polled individuals said that they would be open to financing entirely online.
- More than three-quarters of study respondents said they are open to buying a car completely online.

Car Dealerships Statistics

While the online car-buying market is growing, it doesn’t seem like dealerships are obsolete just yet.
There is something to be said about seeing a car in person, and it’s important to get as much information as possible before making such a big purchase.
Buyers and dealerships alike have taken advantage of the new online resource and mixed the two to create the most efficient buying experience possible.
- 39% of future car buyers plan to visit at least three car dealerships, but only 28% of recent car buyers made that many trips.
- 44% of respondents said they’d feel most comfortable using a combination of in-person and virtual purchasing when buying their next car.
- 87% of buyers noted that negotiating is a necessary step in the process of purchasing a new car.
- 74% of participants prefer to buy EVs at dealerships.
- Only 7% of people want help from a salesperson.
- Only 6% of people indicated they’d feel most comfortable sticking with an all-online shopping experience, so dealerships are still a necessary part of the car-buying experience.
- Dealerships are embracing online ordering as well. 85% of GM dealers are now using Shop-Click-Drive, a shopping tool that allows users to search for certain GM vehicles at local dealerships, apply for financing, get trade-in estimates and complete a portion of the transaction online.
- Many customers who first conducted research online were able to cut down the actual time spent at dealerships buying a car to just 2 hours.
- Over 90% of our customers still visit the showroom and look at the vehicle before making their purchase.
- 38% of customers purchase within 4 hours of visiting their first dealership.
- 90% of customers purchase within 1 week of visiting their first dealership.

Ride-Sharing Service Trends

While COVID put a pause on ride-sharing (being in close quarters with a stranger while there’s a pandemic going on), these ride-share services have begun to rise in popularity once again.
Uber still beats Lyft out in terms of popularity, and young adults aged 19-29 are the age group most likely to use either app.
- Revenue in the rideshare market is projected to reach US$108.00 billion in 2024.
- The number of rideshare users is expected to amount to $195.80m users by 2028.
- In December 2023, Uber accounted for 75 percent of observed U.S. rideshare spending.
- Uber and Lyft are responsible for 6% of vehicle miles traveled (VMT) across the U.S.
- Those between 18-29 are most likely to use ridesharing apps, with at least 51% using them.
- Between 2023 and 2031, the rideshare industry is projected to grow at a CAGR of 20.38%.
- Around 19% of rural residents used a ridesharing service, compared to 45% of urban residents and 40% of suburban residents.
Electric & Hybrid Vehicle Trends

While driving a Tesla was once exclusive to tech bros and rich hippies, the electric vehicle industry has since branched out to allow the general public to experience the benefits of these once-futuristic vehicles.
Check out our more detailed list of EV stats and trends here >>
Accessibility to more charging stations and more big vehicle brands offering options have increased the popularity of EVs and PHEVs.
Global warming has also provided EVs with another marketing opportunity.
- 52% of car buyers now want to purchase an EV.
- Millennials and Gen X-ers are the largest group of people buying electric vehicles (EVs), representing 46% of EV purchases.
- The same age group (25-54) is also the largest group purchasing plug-in hybrid vehicles (PHEV), representing 54% of sales.
- The average price of a used EV is down to $37,000 this year compared to the average price of $50,000 as recently as December 2022.
- The average new EV price was $50,798, according to Kelley Blue Book estimates.
- According to Statista, by 2030, there will be over 3 million electric vehicles driving on California roads.
- 1.2 million U.S. vehicle buyers chose to go electric last year.
- In 2023, the EV share of the total U.S. vehicle market was 7.6%, according to Kelley Blue Book estimates.
- Before the end of this decade, top global automakers have pledged to spend $1.2 trillion to produce 54 million electric vehicles.
- Roughly two-thirds (66%) of Americans surveyed indicated they were more likely to buy an EV after the Biden administration announced plans to support nationwide EV infrastructure and proposed financial incentives to accelerate the country’s move toward EVs.
- Q4 EV sales increased year over year by 40%.
- S&P expects there to be 159 electric vehicle brands by the end of 2025, more than triple today’s 48.
- With more than 100,000 units in combined sales, the Model 3 and Model Y Tesla are two of the best-selling vehicles in the United States.
- 55% of the electric vehicles Americans purchased in 2023 were Tesla products.
- Ford Motor Co. is Tesla’s biggest competitor, holding 7% of registered EVs in 2022 and 28% of non-luxury EVs.
- Tesla’s biggest competitors when it comes to mid-market demand are new EVs, including vehicles from Hyundai Motor Co., Kia Corp., and Volkswagen Group, joining the Ford Mustang Mach-E, the Chevrolet Bolt EV, and the Nissan Leaf.

Current State & Future of Car Inventory

Remember that time when supply chain issues made chip manufacturing impossible (and most of us first learned that there were even chips involved in car production at all)?
The bad news is… we are still in that time. But only for a little while longer!
Here’s how it’s looking up for the car inventory shortage.
- Car production in North America is expected 0.5% increase to reach 15.7 million units.
- The growth is largely driven by a 3.9% uptick in US activity.
- Current word is that it will be at least 2 to 3 years before vehicle production will return to ‘normal’.
- On August 9th, 2022, President Joe Biden signed House Resolution 4346 into law. The CHIPS and Science Act of 2022 appropriates $54.2 billion to support research and production domestically and marks one of the largest investments in addressing the chip shortage.
- Earlier this year, the U.S. Commerce Department reported that the median inventory for semiconductor chips had fallen to just a 5 days’ supply, compared to 40 days before the pandemic.
- Major semiconductor companies said they didn’t expect the situation to go away within the next 6 months.
- In February, Toyota announced it would cut production in the following month by up to 200,000 vehicles globally due to supply chain issues.
- A Canadian trucker protest and an earthquake in Japan have added more complications to the production of new vehicles.
- Globally, almost 1.2 million vehicles have been cut from production, according to Automotive News.
- Before the pandemic, roughly 3.5 million new cars sat on dealer lots. In August, there were about 1.2 million, according to Cox.
Luxury Car Stats & Demographics

Though luxury car prices have generally gone up, sales have gone up with them, and the luxury car market is only going to grow in the future.
Another fun fact: BMW, despite omitting turn signals from their vehicle manufacturing process, is one of the three large German manufacturers that own 70% of the global market share.
- In 2023, the global market for luxury cars was $483.84 billion USD.
- The luxury car market is projected to grow at a CAGR of 4.9% between 2024 and 2032.
- Luxury car unit sales are expected to top 205,900 by 2025.
- As of January 2023, luxury cars sold in the United States cost an average of $75,000 U.S. dollars.
- The most expensive luxury car on the market this year is the Rolls Royce Phantom with an MSRP of up to $547,750.
- The market is projected to grow at a CAGR of 4.9% between 2024 and 2032.
- 86% of luxury buyers agree that they research and compare exhaustively before making a final auto purchase decision.
- 66% agree they rely on the opinions of peers, v. 52% of other new car buyers.
- Luxury car buyers are more likely to be Gen Z and older millennials and to identify as male and Hispanic or Latinx. They tend to be high-income earners, and parents, and live in cities.
- BMW, Mercedes-Benz, and Audi are the three German players that account for 70% of the global market share.
Show Source for This Year’s Stats
- https://www.coxautoinc.com/news/cox-automotives-forecast-2024-a-return-to-normalcy-in-the-u-s-auto-market/
- https://www.automotivedive.com/news/general-motors-q4-sales-hyundai-kia-nissan-subaru-toyota-automakers/703648/
- https://www.automotivedive.com/news/general-motors-q4-sales-hyundai-kia-nissan-subaru-toyota-automakers/703648/
- https://finance.yahoo.com/news/car-prices-drop-2024-auto-120055933.html
- https://www.kbb.com/car-news/new-car-prices-rose-0-3-last-month/
- https://www.caranddriver.com/news/g43553191/bestselling-cars-2023/
- https://www.caranddriver.com/news/g43553191/bestselling-cars-2023/
- https://www.coxautoinc.com/market-insights/estimated-monthly-used-vehicle-saar-and-volume/
- https://www.coxautoinc.com/market-insights/estimated-monthly-used-vehicle-saar-and-volume/
- https://www.coxautoinc.com/market-insights/estimated-monthly-used-vehicle-saar-and-volume/
- https://www.motortrend.com/news/best-selling-cars-trucks-suvs-in-america-2023
- https://www.motortrend.com/news/best-selling-cars-trucks-suvs-in-america-2023
- https://www.motortrend.com/news/best-selling-cars-trucks-suvs-in-america-2023
- https://www.spglobal.com/mobility/en/research-analysis/ethnic-share-in-us-light-vehicle-market-reaches-a-record-33.html
- https://www.spglobal.com/mobility/en/research-analysis/ethnic-share-in-us-light-vehicle-market-reaches-a-record-33.html
- https://www.spglobal.com/mobility/en/research-analysis/ethnic-share-in-us-light-vehicle-market-reaches-a-record-33.html
- https://www.spglobal.com/mobility/en/research-analysis/ethnic-share-in-us-light-vehicle-market-reaches-a-record-33.html
- https://www.spglobal.com/mobility/en/research-analysis/ethnic-share-in-us-light-vehicle-market-reaches-a-record-33.html
- https://www.spglobal.com/mobility/en/research-analysis/ethnic-share-in-us-light-vehicle-market-reaches-a-record-33.html
- https://nationalequityatlas.org/indicators/Car_access#/?geo=01000000000000000
- https://nationalequityatlas.org/indicators/Car_access#/?geo=01000000000000000
- https://nationalequityatlas.org/indicators/Car_access#/?geo=01000000000000000
- https://nationalequityatlas.org/indicators/Car_access#/?geo=01000000000000000
- https://nationalequityatlas.org/indicators/Car_access#/?geo=01000000000000000
- https://www.forbes.com/advisor/car-insurance/car-ownership-statistics/#american-community-survey
- https://www.statista.com/statistics/1267585/us-car-buyers-by-age-group/
- https://hedgescompany.com/blog/2018/10/number-of-licensed-drivers-usa/
- https://www.coxautoinc.com/market-insights/in-2022-low-inventory-and-high-prices-contributed-to-growing-frustration-with-car-buying-process/
- https://www.coxautoinc.com/market-insights/in-2022-low-inventory-and-high-prices-contributed-to-growing-frustration-with-car-buying-process/
- https://www.coxautoinc.com/market-insights/in-2022-low-inventory-and-high-prices-contributed-to-growing-frustration-with-car-buying-process/
- https://hedgescompany.com/blog/2019/01/new-car-buyer-demographics-2019/
- https://hedgescompany.com/blog/2019/01/new-car-buyer-demographics-2019/
- https://hedgescompany.com/blog/2019/01/new-car-buyer-demographics-2019/
- https://hedgescompany.com/blog/2019/01/new-car-buyer-demographics-2019/
- https://hedgescompany.com/blog/2019/01/new-car-buyer-demographics-2019/
- https://hedgescompany.com/blog/2019/01/new-car-buyer-demographics-2019/
- https://hedgescompany.com/blog/2019/01/new-car-buyer-demographics-2019/
- https://hedgescompany.com/blog/2019/01/new-car-buyer-demographics-2019/
- https://hedgescompany.com/blog/2019/01/new-car-buyer-demographics-2019/
- https://hedgescompany.com/blog/2019/01/new-car-buyer-demographics-2019/
- https://hedgescompany.com/blog/2019/01/new-car-buyer-demographics-2019/
- https://hedgescompany.com/blog/2019/01/new-car-buyer-demographics-2019/
- https://hedgescompany.com/blog/2019/01/new-car-buyer-demographics-2019/
- https://hedgescompany.com/blog/2019/01/new-car-buyer-demographics-2019/
- https://hedgescompany.com/blog/2019/01/new-car-buyer-demographics-2019/
- https://hedgescompany.com/blog/2019/01/new-car-buyer-demographics-2019/
- https://www.imarcgroup.com/online-car-buying-market
- https://www.imarcgroup.com/online-car-buying-market
- https://www.imarcgroup.com/online-car-buying-market
- https://porchgroupmedia.com/blog/90-car-shoppers-prefer-dealership-where-they-can-start-buying-process-online/
- https://www.prnewswire.com/news-releases/2022-auto-trends-preorders-go-mainstream-consumer-interest-in-evs-doubles-and-digital-car-buying-accelerates-amid-ongoing-inventory-shortages-301470934.html
- https://www.ibisworld.com/industry-statistics/market-size/online-car-dealers-united-states/
- https://www.ibisworld.com/industry-statistics/market-size/online-car-dealers-united-states/
- https://www.ibisworld.com/industry-statistics/market-size/online-car-dealers-united-states/
- https://www.imarcgroup.com/online-car-buying-market
- https://www.prnewswire.com/news-releases/2022-auto-trends-preorders-go-mainstream-consumer-interest-in-evs-doubles-and-digital-car-buying-accelerates-amid-ongoing-inventory-shortages-301470934.html
- https://www.capitalone.com/about/newsroom/car-buying-outlook-report-2023/
- https://www.wardsauto.com/dealers/poll-people-say-online-vehicle-financing-saves-time
- https://www.wardsauto.com/dealers/poll-people-say-online-vehicle-financing-saves-time
- https://www.capitalone.com/cars/learn/finding-the-right-car/car-buyers-say-dealerships-matter-more-than-dealers-think/1301
- https://www.capitalone.com/cars/learn/finding-the-right-car/car-buyers-say-dealerships-matter-more-than-dealers-think/1301
- https://www.capitalone.com/cars/learn/finding-the-right-car/car-buyers-say-dealerships-matter-more-than-dealers-think/1301
- https://www.autonews.com/retail/why-many-ev-buyers-still-prefer-dealerships
- https://www.thezebra.com/resources/driving/online-car-buying-survey/
- https://www.capitalone.com/cars/learn/finding-the-right-car/car-buyers-say-dealerships-matter-more-than-dealers-think/1301
- https://abcnews.go.com/Business/consumers-shopping-online-cars-dealerships/story?id=76650042
- http://kbb.com/car-advice/crazy-stats-online-car-buying-pandemic/
- https://webinarcare.com/best-car-dealer-software/car-dealer-statistics/
- https://webinarcare.com/best-car-dealer-software/car-dealer-statistics/
- https://webinarcare.com/best-car-dealer-software/car-dealer-statistics/
- https://www.statista.com/outlook/mmo/shared-mobility/shared-rides/united-states
- https://www.statista.com/outlook/mmo/shared-mobility/shared-rides/united-states
- https://secondmeasure.com/datapoints/rideshare-industry-overview/
- https://www.zippia.com/advice/ridesharing-industry-statistics/
- https://www.zippia.com/advice/ridesharing-industry-statistics/
- https://www.globenewswire.com/en/news-release/2023/12/07/2792656/0/en/Global-Ride-Sharing-Market-Size-is-Estimated-to-Reach-USD-564-20-billion-by-2031-Growing-at-a-CAGR-of-20-38-Straits-Research.html
- https://www.buckleup.com/post/2022-ridesharing-industry-statistics
- https://electrek.co/2022/05/27/52-percent-global-car-buyers-want-to-purchase-ev/
- https://hedgescompany.com/blog/2019/01/new-car-buyer-demographics-2019/
- https://hedgescompany.com/blog/2019/01/new-car-buyer-demographics-2019/
- https://www.nbcnews.com/business/autos/buy-ev-2024-electric-car-sales-slow-rcna132944
- https://www.coxautoinc.com/market-insights/kbb-atp-december-2023/
- https://webinarcare.com/best-car-dealer-software/car-dealer-statistics/
- https://www.coxautoinc.com/market-insights/q4-2023-ev-sales/
- https://www.coxautoinc.com/market-insights/q4-2023-ev-sales/
- https://www.wired.com/story/2022-was-the-year-that-electric-vehicles-took-off/
- https://www.prnewswire.com/news-releases/2022-auto-trends-preorders-go-mainstream-consumer-interest-in-evs-doubles-and-digital-car-buying-accelerates-amid-ongoing-inventory-shortages-301470934.html
- https://www.coxautoinc.com/market-insights/q4-2023-ev-sales/
- https://www.investopedia.com/tesla-ev-dominance-decreasing-6834156
- https://cleantechnica.com/2022/10/13/fully-electric-vehicles-reached-6-of-auto-sales-in-usa-in-3rd-quarter/
- http://athensceo.com/news/2024/01/americans-buy-nearly-12-million-electric-vehicles-hit-record-2023-according-latest-kelley-blue-book-data/
- https://www.investopedia.com/tesla-ev-dominance-decreasing-6834156
- https://www.investopedia.com/tesla-ev-dominance-decreasing-6834156
- https://www.motor1.com/news/701193/88-million-cars-to-be-sold-globally
- https://www.motor1.com/news/701193/88-million-cars-to-be-sold-globally
- https://www.motorcarstoyota.com/when-will-the-car-shortage-end/
- https://www.carsdirect.com/deals-articles/latest-new-car-chip-shortage-updates
- https://www.carsdirect.com/deals-articles/latest-new-car-chip-shortage-updates
- https://www.carsdirect.com/deals-articles/latest-new-car-chip-shortage-updates
- https://www.carsdirect.com/deals-articles/latest-new-car-chip-shortage-updates
- https://www.carsdirect.com/deals-articles/latest-new-car-chip-shortage-updates
- https://www.carsdirect.com/deals-articles/latest-new-car-chip-shortage-updates
- https://www.nerdwallet.com/article/loans/auto-loans/when-will-the-car-market-return-to-normal
- https://www.expertmarketresearch.com/reports/luxury-car-market
- https://www.expertmarketresearch.com/reports/luxury-car-market
- https://www.coxautoinc.com/market-insights/kbb-atp-september-2022/
- https://www.statista.com/statistics/1291182/average-new-luxury-vehicle-price-by-type-usa/
- https://www.truecar.com/best-cars-trucks/cars/expensive/
- https://www.expertmarketresearch.com/reports/luxury-car-market
- https://go.cargurus.com/rs/611-AVR-738/images/Luxury-Buyers-Snapshot.pdf
- https://go.cargurus.com/rs/611-AVR-738/images/Luxury-Buyers-Snapshot.pdf
- https://www.trendstatistics.com/automotive/luxury-car-statistics
- https://www.trendstatistics.com/automotive/luxury-car-statistics